The Polar Graph Control |
| The Polar graph control is a GUI element that can be used to display one or more graphs. The Polar graph control has a collection of graphs. Each graph has a color, a caption, a type and a collection of radius and theta values. A graph can be added to a Polar graph control using the method Add of the control. El control de Polar graph es un elemento GUI que puede ser usado para mostrar una o más gráficas. El control de Polar graph tiene una colección de gráficas. Cada gráfica tiene un color, un texto, un tipo y una colección de valores de radio y ángulo theta. Una gráfica puede ser agregada a un control de Polar graph usando el método Add del control. |
| Problem 1 |
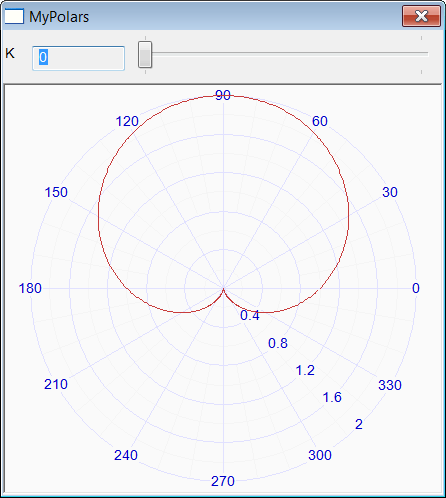
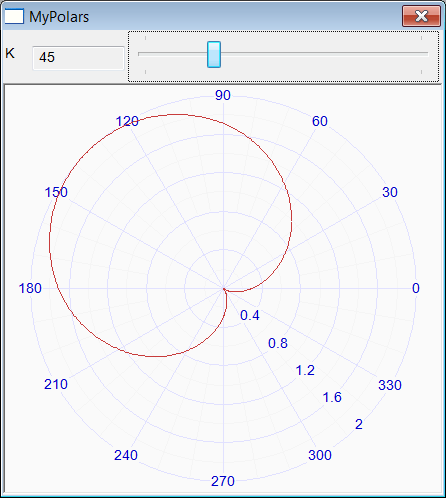
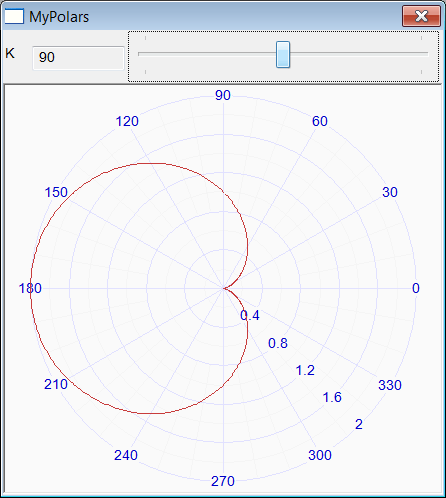
| Create a program called MyPolars to graph a Cardioid, r = 1 + sin(theta), using the Polar Chart control. Use a slider to rotate the Cardioid as shown. Cree un programa llamado MyPolars para graficar un Cardiode, r = 1 + sin(theta), usando un control Polar Chart. Use un slider para rotar el Cardiode como se muestra. |


| Tip |
| Check the Dialog properties: "Clip Child Windows" and "Resizing Borders". Seleccione las propiedades del Diálogo: "Clip Child Windows" and "Resizing Borders". |